What is a QCRM
What is a QCRM (internal quality control reference material)
QCRMs enable your laboratory to check that there is no drift in its results
A QCRM is a set of samples prepared in-house to check that there is no drift in the laboratory's results. In practice, it means :
- Prepare a large number of samples that are as identical as possible. If the products change over time (concrete, paints, etc.), this point must also be considered (for example, provide storage conditions or an expiry date);
- If the test is non-destructive, a single sample may be used, but its internal homogeneity must be as good as possible;
- Determine the characteristics of the corresponding product using repeated tests. The number of repetitions must be sufficient (typically 30) to ensure good precision of the determinations. The results are expressed in the form of a central value (typically a mean "m") and a dispersion parameter (typically a standard deviation "s");
- If the test is non-destructive, the initial tests must be repeated a large number of times on the same sample to determine the normal dispersion of the test;
- Then carry out a test periodically (typically once a month, to be adjusted according to the risk of drift) to check that the result is consistent with the initial series of tests (typically, the result should be within the interval m±2s).
The following standards describe the preparation and use of QCRM:
- ISO Guide 80 for sample preparation ;
- ISO 7870-1 to 8 for control charts.
The use of a QCRM makes it possible to satisfy requirement § 7.7.1 of ISO/IEC 17025:2015 (options a and d).
Example:
60 concrete steel specimens are cut from a single ring of steel. 30 of these are immediately subjected to the tensile test to determine the tensile strength Rm, yield strength Rp0.2 and elongation Agt. The following results were obtained:
| Characteristics |
Mean value |
Standard deviation |
Limits |
|
Rm (MPa) |
634 |
12 |
610 & 668 |
|
Rp0,2 (MPa) |
552 |
14 |
524 & 580 |
|
Agt (%) |
6,3 |
0,9 |
5,4 & 6,2 |
The laboratory then carries out one test per month on the remaining samples. If the results fall outside the limits set, it is likely that a drift is developing. The laboratory can immediately launch an investigation into its resources to find the cause of any problem.
Other criteria exist and may be more appropriate, depending on the situation. A great deal of information on this subject is given in the ISO 7870 series of standards.
What a classic QCRM can do for you
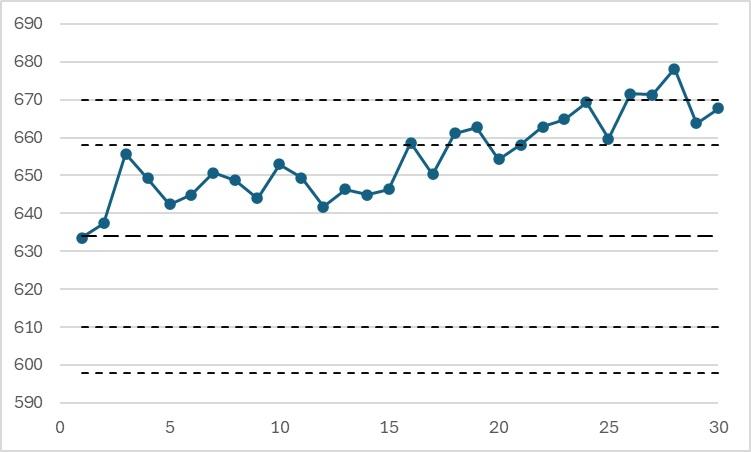
The use of a classic QCRM makes it possible to detect a slow or sudden drift in the laboratory's results. After a drift has occurred, the results on the same samples become significantly different from the initial results and an alert can be generated.
Example of slow drift (with limits of the example of the characteristic "Rm" from the table here upper):
What you can't get with a traditional QCRM
Using a traditional QCRM does not detect :
- Systematic laboratory error: if all 30 initial results are affected by a systematic error, this will not be detected by a conventional QCRM;
- Insufficient repeatability by the laboratory: if the laboratory's results are too scattered, this will not be detected by a conventional QCRM;
- Uncertainty poorly assessed by the laboratory.
Examples of significant systematic error on the 30 initial results (the limits are calculated from the true value of the material and the method's reproducibility standard deviation). The results are the same as above:
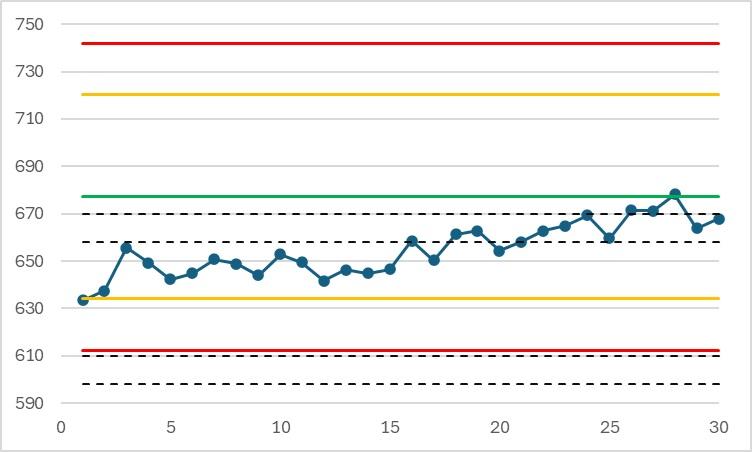
In this example, the drift reduces the bias, which is significant from the start. When the alert is detected, there is no urgent need to take corrective action.
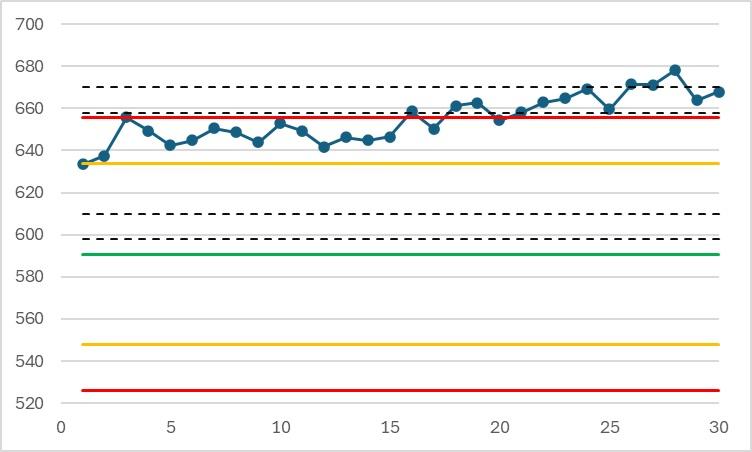
In this example, drift increases the bias. When the alert is detected, the results have been out of control for a long time.
Example of insufficient laboratory repeatability (limits are calculated from the true value of the material and the method's reproducibility standard deviation). The results are the same as above:
When the alert is detected, the results have been out of control for a long time.
Furthermore, if the number of repetitions is insufficient, the reliability of the QCRM's alert limits may be poor.
There is then a risk of incorrect alerts being triggered or of alerts not being triggered when they should be. The graphs below show the 95% confidence intervals for the alert limits m+2s and m+3s, where m and s are estimated from N initial results, with N varying from 5 to 32.
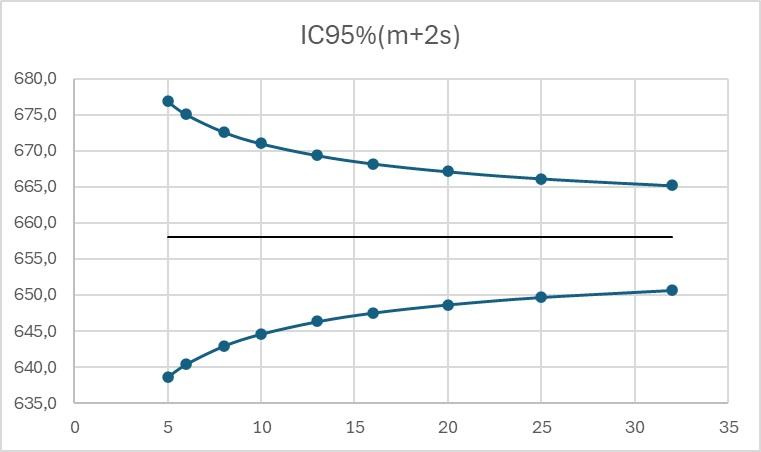
It can be seen that for a real warning limit value equal to 658 MPa, the 95% confidence interval is [638:677] for limits calculated from 5 results and [650:666] for limits calculated from 30 results.
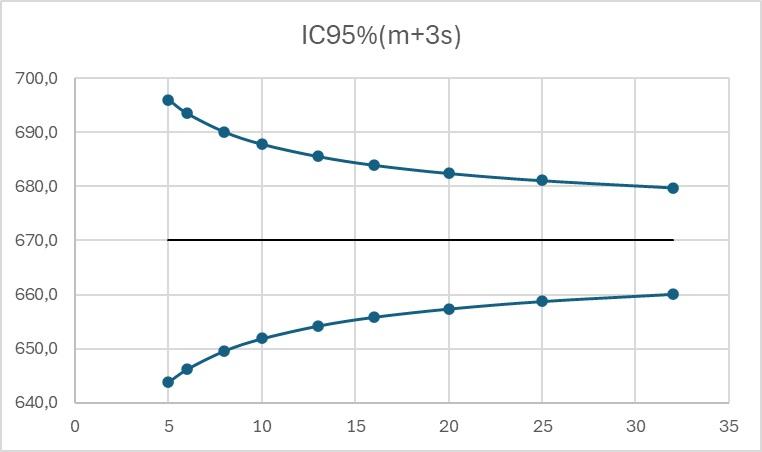
We can see that for a real value of action limit equal to 670 MPa, the 95% confidence interval is [643:696] for limits calculated from 5 results and [660:681] for limits calculated from 30 results.
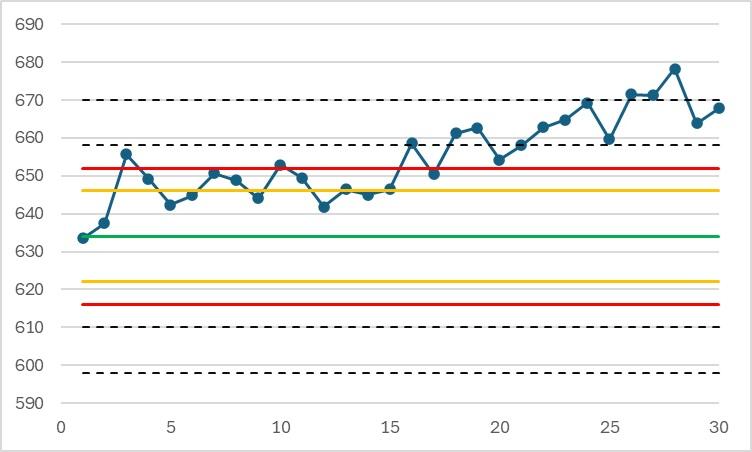
Example of a possible situation for limits determined from 10 test results:
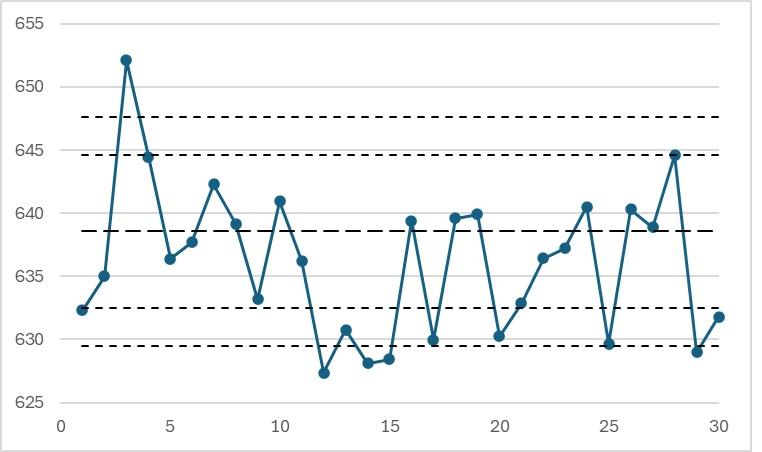
In this example, many inappropriate alerts are triggered.
CompaLab QCRMs provide a solution to this problem:
see What is a CompaLab QCRM?