Why should I use CompaLab QCRMs
CompaLab QCRMs have been optimised to provide the user laboratory with maximum information for minimum resources. In particular, they enable to :
- Eliminate the extensive preliminary work normally required to set up a control chart;
- Use the information from the PTs to set up control charts that would be impossible for an isolated laboratory to set up;
- Provide additional information to the control charts (standard deviations of the laboratory and their position in relation to the references, breakdown of the intra-laboratory variance into the various effects that make it up (operator, equipment, environmental conditions, other), highlighting of factors with a significant impact).
Eliminate the extensive preliminary work normally required to set up a control chart
With CompaLab control cards, there's no need to carry out a large number of tests beforehand:
To be effective, conventional control charts require a large number of preliminary tests (typically 30) to determine the control chart's reference standard deviations with sufficient accuracy. With CompaLab control charts, this work becomes unnecessary because reliable standard deviations are determined thanks to the CIL from which the samples are taken.
CompaLab control cards are optimised to enable laboratories to make the most of tests carried out under §7.7.1 of the ISO/IEC 17025 standard:
A control card can only be effective if a great deal of prior research has been carried out to define the objectives being pursued and the most effective types of control card for this purpose. Evaluating the different types of card that exist, and their respective advantages and disadvantages, is a long and difficult task and, in most cases, laboratories do not have the time to carry it out. The result is control boards that are generally not very effective and, as a result, the resources spent by the laboratory on supplying them are under-utilised. CompaLab has had all the time it needs to develop its control charts, compare the different types that exist, assess their effectiveness for the tests they are intended to monitor and make the most of the tests devoted to quality monitoring.
Use the information from the PTs to set up control charts that would be impossible for an isolated laboratory to set up
CompaLab control cards are designed to allow multiple assessments using a single series of tests:
The same test results are used for all the assessments, which means that more information can be obtained for monitoring the quality of the tests with fewer resources for the laboratory. They make it possible to monitor :
- Laboratory bias
- Bias drift
- Repeatability
- Uncertainty of results
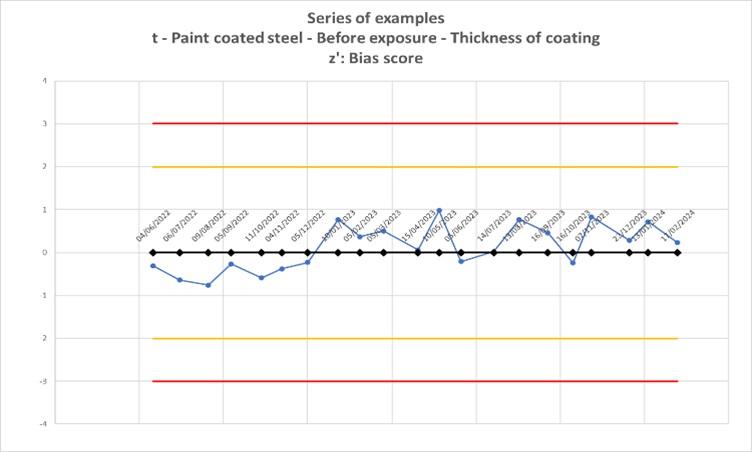
CompaLab control cards enable you to monitor the laboratory's bias
The PT was used to determine the reference value for each characteristic and the corresponding interlaboratory standard deviation. This information is inaccessible to an isolated laboratory. With CompaLab control charts, the laboratory can constantly check that its bias remains under control.
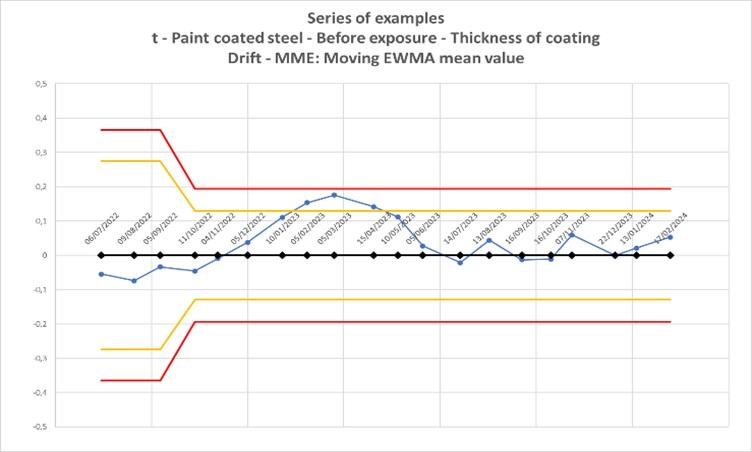
CompaLab control charts can be used to monitor the drift of the laboratory's bias
Various Monte-Carlo simulations have been used to determine the best control chart for detecting any bias drift as quickly as possible and with the lowest possible risk of false alarms. With the CompaLab control charts, the laboratory can constantly check that its bias drift remains under control.
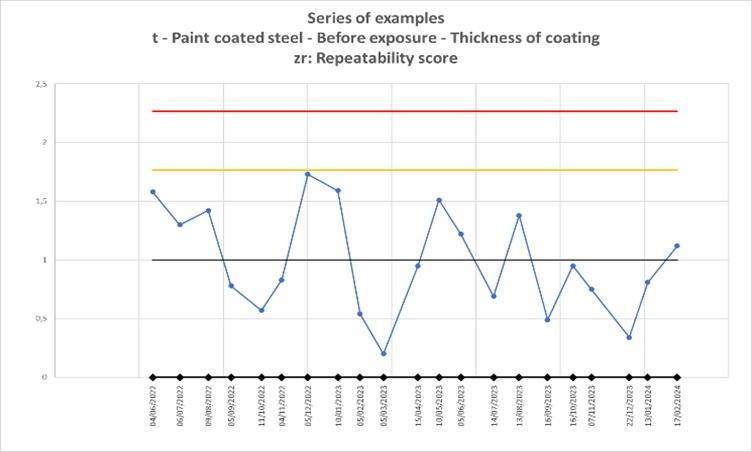
CompaLab control charts are used to monitor the laboratory's repeatability
The PT was used to determine the reference value for repeatability. This information is inaccessible to an isolated laboratory. With CompaLab control charts, the laboratory can constantly check that its repeatability remains under control.
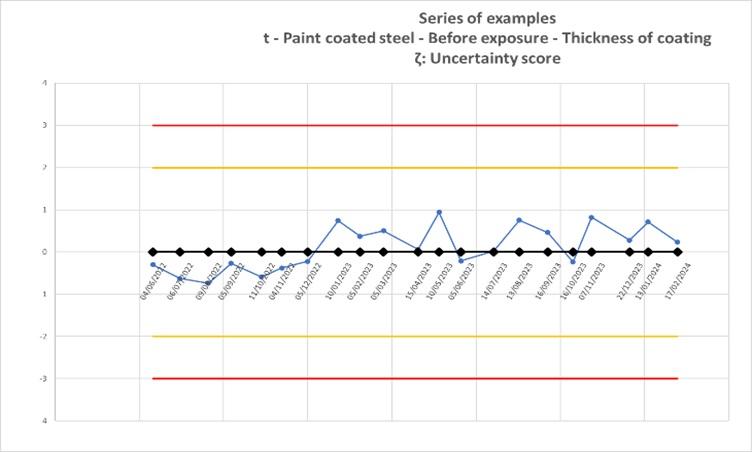
CompaLab control charts can be used to monitor laboratory uncertainty
To check whether the laboratory's uncertainty, CompaLab control charts use the ζ score technique (see ISO standard 13528). This technique consists of checking that the difference between the laboratory's results and the reference value is compatible with the declared uncertainty. With CompaLab control charts, the laboratory can constantly check that its uncertainty remains under control.
CompaLab provides information to help understand the sources of alerts when they occur
Sometimes it is not easy for a laboratory to understand why an alert is generated. This represents a waste of time and money for the laboratory, which looks for the sources of alerts in the wrong directions.
Instructions for using the control cards are available to users. These instructions provide a series of typical examples of control chart layouts corresponding to particular situations of lack of control (e.g. bias too great, uncertainty too small or too great, etc.). These examples help everyone to understand the meaning and find the real cause of the alerts generated.
In addition to these control charts, the CompaLab file provides useful information for the laboratory
The supplied file can be used to qualify a new operator or a new piece of equipment
The supplied samples can also be used to qualify a new operator or a new piece of equipment. The instructions and file provided allow the necessary calculations to be made.
The file provides the value of the intra-laboratory standard deviation and its position relative to the reference standard deviations for repeatability and reproducibility.
A laboratory generally uses several operators and several pieces of equipment. It supplies results obtained under environmental conditions that vary throughout the year. The overall evaluation of the results used for the control chart makes it possible to assess the overall standard deviation of the laboratory's results, including all these variations over time. This standard deviation is normally intermediate between the repeatability standard deviation and the reproducibility standard deviation (see the notion of "intermediate precision" in standard ISO 5725-1).
The file provides a decompositionof the intra-laboratory variance between the various effects that make it up (operator, equipment, environmental conditions, other)
This decomposition makes it possible to identify the main sources of uncertainty and, if necessary, to identify those on which priority action should be taken to reduce this uncertainty or deal with alerts.
The file highlights a factor that has a significant impact on the laboratory's performance.
Data entry enables the results of each control point to be linked to an operator and a piece of equipment. The file can be used to identify whether an operator or piece of equipment is providing results that are different from those of others, and thus whether corrective action needs to be taken (e.g. re-training a particular operator, checking a particular piece of equipment).
The file provides the laboratory with an expanded uncertainty which takes into account both its bias and its random error.
The overall use of the results and their comparison with the known reference value using the CIL enables the laboratory's overall uncertainty to be calculated, without the laboratory having to perform any additional calculations.
How are CompaLab QCRMs different from CRMs (certified reference materials)?
CRMs (certified reference materials) are produced in accordance with ISO 17034 and ISO 33405 (which replaced ISO Guide 35) and are certified in accordance with these standards. For this reason, the uncertainty in the certified value of CRMs is normally better than the uncertainty in the assigned value obtained during proficiency testing.
However, these certificates do not provide fidelity standard deviations (repeatability and reproducibility) because they are primarily intended for the calibration of measuring equipment. They therefore do not provide any information that can be used to determine relevant limits for use in control charts.
CompaLab QCRMs are essentially intended for use in control charts. They do not meet the requirements of ISO/IEC 17034 and cannot benefit from corresponding accreditation, which is not in any case required for use in response to requirement 7.7.1 of ISO/IEC 17025. However, they do benefit from knowledge of their repeatability and reproducibility standard deviations, and from the calculation file needed to draw up the control charts. Since they are less complex to produce than CRMs, they are normally less expensive.
To qualify an operator or piece of equipment
- Using a CRM provides a more accurate reference value than a QCRM, but the laboratory itself must determine the permissible deviation from the reference value to decide whether or not qualification can be granted. The correct way to calculate this permissible deviation is to determine the quadratic sum of the uncertainty of the CRM (supplied with it) and the uncertainty of the laboratory. If the laboratory's determination of uncertainty has been approximate, qualification may be wrongly granted or refused;
- Using a CompaLab QCRM allows you to benefit from the known standard deviations attached to these QCRMs and from the calculation file also provided. The accuracy obtained on the reference value is generally a little lower, but the accuracy obtained on the admissible deviations is much better. Overall, using a QCRM is a more reliable way of qualifying an operator or piece of equipment.
It should be noted that:
- The results of the CompaLab PTs show that the uncertainties determined by the participating laboratories are almost systematically underestimated, particularly for technological tests (bending, corrosion, paint tests, etc.). The risk of wrongly refusing a qualification is therefore often high;
- For many tests, no CRM is available. It is then obviously impossible to use a CRM to validate qualifications.
To sum up:
- If you want to calibrate equipment, use a CRM (preferably accredited to ISO/IEC 17034) from a specialist supplier;
- If you want to set up control charts to meet the requirement of ISO/IEC 17025 § 7.7.1, use CompaLab's QCRMs;
- If you want to qualify an operator or a piece of equipment and if QCRMs exist for this test, you can use either, but using CompaLab QCRMs is simpler, more reliable and less expensive.
Need more information? Need a quote?
Don't hesitate to contact CompaLab using the form!