Description of an interlaboratory comparison
A proficiency test enables to evaluate the reliability of the services of your laboratory
A inter laboratory comparison (or proficiency test or PTP or round robin test) consists in testing the same samples by different laboratories and in comparing the results. Three different objectives can be pursued:
- Validate a test method and determine the uncertainty of results, via the determination of the standard deviations of repeatability and reproducibility;
- Determine the characteristics of a product intended for be used as a reference material;
- Assess the reliability of the test results of the participating laboratories.
Inter laboratory comparisons organised by CompaLab pursue the latter goal: proficiency testing of laboratories. They provide to participants a way to fulfil the requirements of ISO/IEC 17025 § 7.7.2.
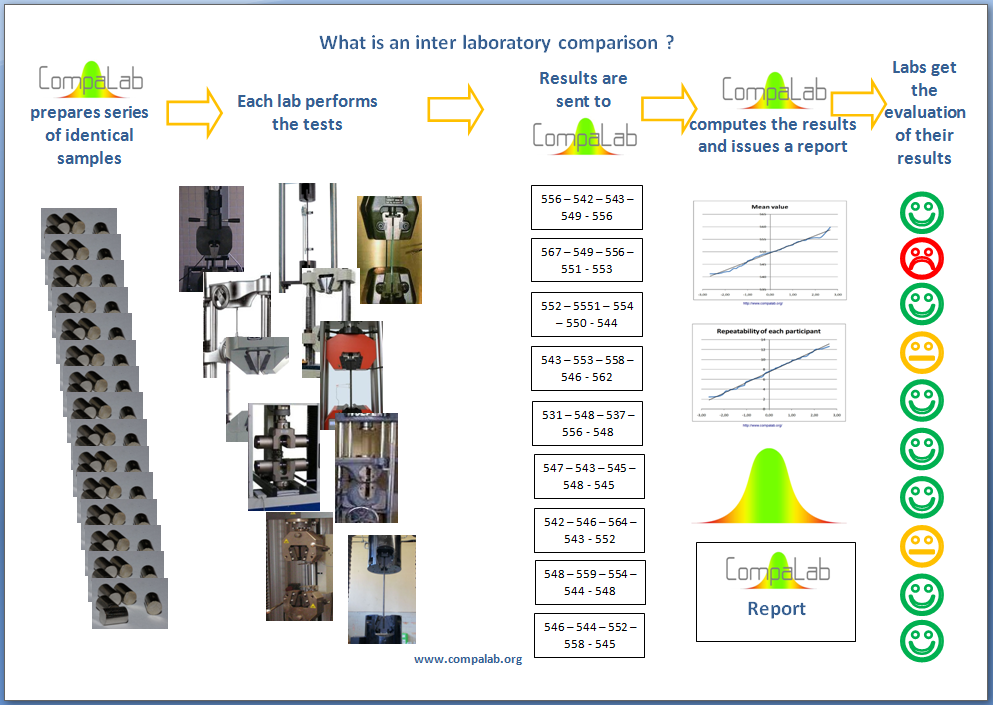
In practice, it consists in:
- Sending to a sufficient number of laboratories a series of samples as similar as possible;
- Running a series of tests by all participating laboratories;
- Determining a reference value to be found for the test results;
- Evaluating the difference between the results of each laboratory and the reference value;
- And concluding a level of confidence in the outcome of the test.
The requirements for the organisation of the inter laboratory comparisons / round robin tests are different depending on the objective. These requirements are also described in three different international standards (see ISO 5725-2, ISO Guide 35 and ISO 13528 for proficiency tests).
Each participating laboratory may well know the difference between the test results it produces and the reference value ("the value which was to be found"). The results are transmitted to it confidentially. It is up to it alone to determine if an internal corrective action must be implemented.
More details concerning:
Why participate to an inter laboratory comparison ILC / PTP ?
How are fixed reference values and acceptable deviations?
Values regarded as references are usually computed as average values of all the participants, corrected from the effects of outliers. However, other possibilities exist, that can be better options, according to the ILC conditions: composition formula of the samples, certified reference materials, results of one or a few reference laboratories, externally fixed values.
In the same way, standard deviations regarded as reference are usually computed from the results of participants. Externally fixed values can also be used, in relationship with the needs of the users of test results.
What types of evaluations are performed?
Three types of evaluation are usually performed:
- Check of the gap between the average value of the laboratory and the reference value (bias);
- Check of the scatter of the individual results within the laboratory;
- Check of the uncertainty claimed by the laboratory.
Check of the bias
The gap between the average value of the laboratory and the reference value is usually checked by the mean of a score that characterise this gap compared to a reference which represents what is acceptable. The most usual score is called z-score, which is computed by the following formula: z = (Xi-Xpt)/Spt, where Xi represents the value of the laboratory results, Xpt represents the reference value and Spt represents the overall standard deviation of laboratory results. Limits for this score are usually fixed to ±2 for a signal of alert and ±3 for a signal of action, corresponding to nominal probabilities to occur of respectively 5% and 0,3%. However, other limits can make sense, in accordance with risks linked to lack of alerts.
On the following figure, results of laboratories are represented in different colours (one per lab). The black circle represents the extended uncertainty on the determined reference value. Orange and red circles represent the limits for signal of alert and for signal of action concerning bias. The results of two participants (in brown) are close to the signal of alert while another (in yellow and green) clearly triggers a signal of action.

Triggering a signal of action means that a significant systematic error occurs in the laboratory. In that case, the laboratory should enquire about the roots of this systematic error. Most common errors come from 1- error in reporting the results, 2- lack of competence of the personnel, 3- problem in the preparation of the test specimens, 4- problem with the test equipment.
Check of the scatter of the laboratory individual results
Several methods can be used to assess the scatter of the results of the laboratory. Most of them are based on the hypothesis of homoscedasticity: all participants show the same internal scatter, linked to the precision of the test method (in the sense of ISO 5725-1) and on the confidence interval on the estimation of a standard deviation (see ISO 2854).
In most cases, the organiser of the ILC requests participants to perform the tests on conditions of repeatability (same operator, same test equipment, same environmental conditions). The scatter of a laboratory’s results is then its repeatability.

Orange and red circles around the results of the participant in yellow and green represent the limits for signal of alert and for signal of action concerning the scatter for this participant. A signal of action is clearly triggered for this participant, as its results are significantly more scattered than the other participants results.
Triggering a signal of action means that the scatter of the laboratory’s results is too large. In that case, the laboratory should enquire about the roots of this scatter. Most common roots for abnormal scatters are same than for the bias: 1- error in reporting the results, 2- lack of competence of the personnel, 3- problem in the preparation of the test specimens, 4- problem with the test equipment. However, in that case, they mainly consist in lack of care or erratic malfunction rather than wrong procedures or biased equipment.
Check of the uncertainty claimed by the laboratory.
The assessment of the uncertainty claimed by the laboratory is usually performed by checking whether the difference between the participant’s results and the reference value is consistent with the combination of both the participant’s claimed uncertainty and the uncertainty on the reference value.
For example, in the following figure, where black circles represent the enlarged uncertainties on the reference value and on the participant’s results (in yellow and green), show that no common zone exists between these 2 circles. In other words, the interval of confidence on results of this participant cannot include the true value (which is supposed to be located inside the circle around the reference value), even if neither a significant gap nor an anormal scatter occurs in that case.

On the other hand, on the following figure, the 2 black circles show a common zone. In other words, the interval of confidence around the results in yellow and green is likely to include the true value, even if significant gap and scatter occur for these results.

Triggering a signal of action means that the uncertainty computed by the laboratory is underestimated. The laboratory should reconsider the determination of the uncertainties it claims.